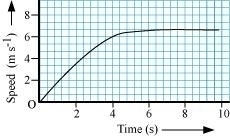
The speed-time graph for a car is shown is Fig. 8.12.
The speed-time graph for a car is shown is Fig. 8.12.
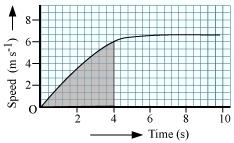
(a) Find out how far the car travels in the first 4 seconds. Shade the area on
the graph that represents the distance travelled by the car during the period.
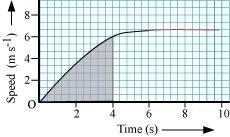
(b) Which part of the graph represents uniform motion of the car?
Answer
(a)
The shaded area which is equal to 1/2 � 4 � 6 = 12 m represents the distance
travelled by the car in the first 4 s.
(b)
The part of the graph in red colour between time 6 s to 10 s represents uniform
motion of the car.