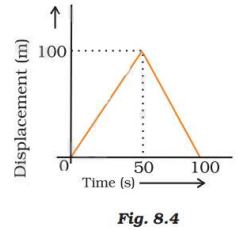
A girl walks along a straight path to drop a letter in the letterbox and comes back to her initial position. Her displacement–time graph is shown in Fig. 8.4. Plot a velocity–time graph for the same.
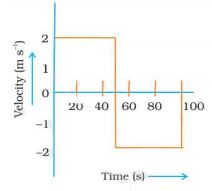
Ans. For the initial 50 second, velocity is 2 m/s. After that, velocity drops of
zero; as shown by vertical line in graph.
For the next 50 second, velocity is taken in negative because displacement is
becoming zero.