
Which of the two graphs (a) and (b) (Fig.12.3) representing the human voice is likely to be the male voice? Give reason for your answer.
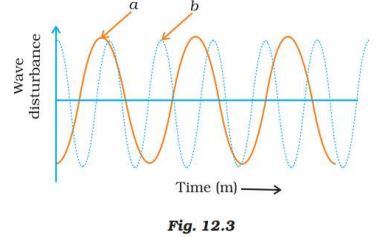
Ans. Graph (a) represents the male voice. Usually the male voice has less pitch (or frequency) as compared to female.