
Figure 15.1 shows the two crop fields [Plots A and B] have been treated by manures and chemical fertilizers respectively, keeping other environmental factors same. Observe the graph and answer the following questions.
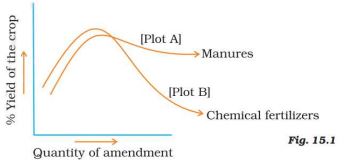
(i) Why does plot B show sudden increase and then gradual decrease in yield?
Ans. With addition of chemical fertilizer there is sudden increase in yield due
to release of nutrients N,P,K etc in high quantity. The gradual decline in the
graph may be due to continuous use and high quantity of chemicals which kills
microbes useful for replenishing the organic matter in the soil. This decreases
the soil fertility.
(ii) Why is the highest peak in plot A graph slightly delayed?
Ans. Manures supply small quantities of nutrients to the soil slowly as it
contains large amounts of organic matter [Hint: importance of organic matter can
be included]. It enriches soil with nutrients thereby increasing soil fertility
continuously.
(iii) What is the reason for the different pattern of the two graphs?
Ans. The difference in the two graphs indicate that use of manure is
beneficial for long duration in cropping as the yield tends to remain high when
the quantity of manure increases.
In case of Plot B the chemical fertilizers may cause various problems when used
continuously for long time. Loss of microbial activity reduces decomposition of
organic matter and as a result soil fertility is lost that affects the yield.