The runs scored by two teams A and B on the first 60 balls in a cricket match are given below:
|
Number of balls |
Team A |
Team B |
|
1 - 6 7 - 12 13 - 18 19 - 24 25 - 30 31 - 36 37 - 42 43 - 48 49 - 54 55 - 60 |
2 1 8 9 4 5 6 10 6 2 |
5 6 2 10 5 6 3 4 8 10 |
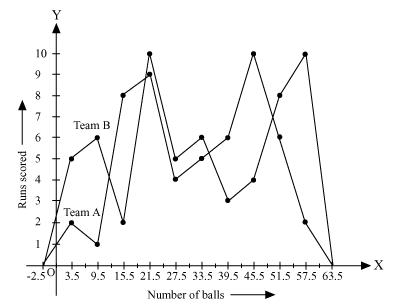
Represent the data of both the teams on the same graph by frequency polygons.
[Hint: First make the class intervals continuous.]
It can be observed that the class intervals of the given data are not continuous. There is a gap of 1 in between them. Therefore, 1/2 =0.5 has to be added to the upper class limits and 0.5 has to be subtracted from the lower class limits.
Also, class mark of each interval can be found by using the following formula.
Class mark 
Continuous data with class mark of each class interval can be represented as follows.
|
Number of balls |
Class mark |
Team A |
Team B |
|
0.5 - 6.5 |
3.5 |
2 |
5 |
|
6.5 - 12.5 |
9.5 |
1 |
6 |
|
12.5 - 18.5 |
15.5 |
8 |
2 |
|
18.5 - 24.5 |
21.5 |
9 |
10 |
|
24.5 - 30.5 |
27.5 |
4 |
5 |
|
30.5 - 36.5 |
33.5 |
5 |
6 |
|
36.5 - 42.5 |
39.5 |
6 |
3 |
|
42.5 - 48.5 |
45.5 |
10 |
4 |
|
48.5 - 54.5 |
51.5 |
6 |
8 |
|
54.5 - 60.5 |
57.5 |
2 |
10 |
By taking class marks on x-axis and runs scored on y-axis, a frequency polygon can be constructed as follows.