It is given that a grouped frequency distribution table of class size 5 has to be constructed. Therefore, the class intervals will be 0 - 5, 5 - 10, 10 - 15, 15 - 20…
By observing the data given as above, a grouped frequency distribution table can be constructed as follows.
|
Distance (in km) |
Tally mark |
Number of engineers |
|
0 - 5 |
|
5 |
|
5 - 10 |
|
11 |
|
10 - 15 |
|
11 |
|
15 - 20 |
|
9 |
|
20 - 25 |
|
1 |
|
25 - 30 |
|
1 |
|
30 - 35 |
|
2 |
|
Total |
40 |
It can be observed that there are very few engineers whose homes are at more than or equal to 20 km distance from their work place. Most of the engineers have their workplace up to 15 km distance from their homes.
(i) By representing causes on x-axis and family fatality rate on y-axis and choosing an appropriate scale (1 unit = 5% for y axis), the graph of the information given above can be constructed as follows.
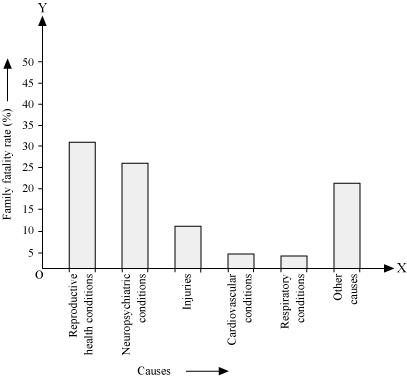
All the rectangle bars are of the same width and have equal spacing between them.
(ii) Reproductive health condition is the major cause of women's ill health and death worldwide as 31.8% of women are affected by it.
(iii) The factors are as follows.
1. Lack of medical facilities
2. Lack of correct knowledge of treatment
(i) By representing section (variable) on x-axis and number of girls per thousand boys on y-axis, the graph of the information given above can be constructed by choosing an appropriate scale (1 unit = 100 girls for y-axis)
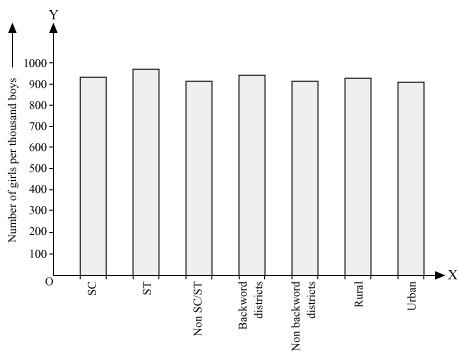
Here, all the rectangle bars are of the same length and have equal spacing in between them.
(ii) It can be observed that maximum number of girls per thousand boys (i.e., 970) is for ST and minimum number of girls per thousand boys (i.e., 910) is for urban.
Also, the number of girls per thousand boys is greater in rural areas than that in urban areas, backward districts than that in non-backward districts, SC and ST than that in non-SC/ST.
(i) By taking polling results on x-axis and seats won as y-axis and choosing an appropriate scale (1 unit = 10 seats for y-axis), the required graph of the above information can be constructed as follows.
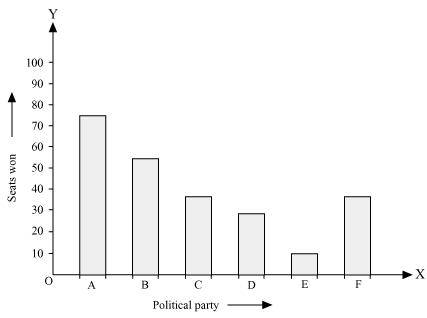
Here, the rectangle bars are of the same length and have equal spacing in between them.
(ii) Political party 'A' won maximum number of seats.
(i) It can be observed that the length of leaves is represented in a discontinuous class interval having a difference of 1 in between them. Therefore,
1/2 =0.5 has to be added to each upper class limit and also have to subtract 0.5 from the lower class limits so as to make the class intervals continuous.
|
Length (in mm) |
Number of leaves |
|
117.5 - 126.5 |
3 |
|
126.5 - 135.5 |
5 |
|
135.5 - 144.5 |
9 |
|
144.5 - 153.5 |
12 |
|
153.5 - 162.5 |
5 |
|
162.5 - 171.5 |
4 |
|
171.5 - 180.5 |
2 |
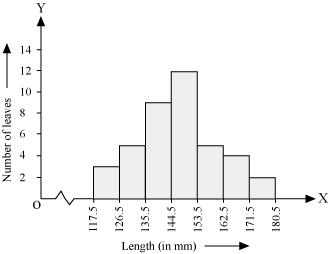
Taking the length of leaves on x-axis and the number of leaves on y-axis, the histogram of this information can be drawn as above.
Here, 1 unit on y-axis represents 2 leaves.
(ii) Other suitable graphical representation of this data is frequency polygon.
(iii) No, as maximum number of leaves (i.e., 12) has their length in between 144.5 mm and 153.5 mm. It is not necessary that all have their lengths as 153 mm.
(i) By taking life time (in hours) of neon lamps on x-axis and the number of lamps on y-axis, the histogram of the given information can be drawn as follows.

Here, 1 unit on y-axis represents 10 lamps.
(ii) It can be concluded that the number of neon lamps having their lifetime more than 700 is the sum of the number of neon lamps having their lifetime as 700 - 800, 800 - 900, and 900 - 1000.
Therefore, the number of neon lamps having their lifetime more than 700 hours is 184. (74 + 62 + 48 = 184)
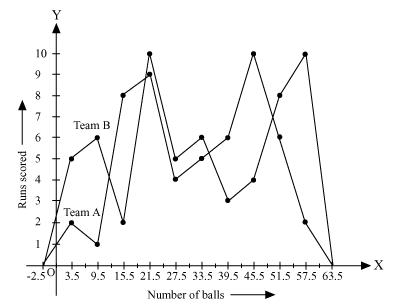
It can be observed that the class intervals of the given data are not continuous. There is a gap of 1 in between them. Therefore, 1/2 =0.5 has to be added to the upper class limits and 0.5 has to be subtracted from the lower class limits.
Also, class mark of each interval can be found by using the following formula.
Class mark 
Continuous data with class mark of each class interval can be represented as follows.
|
Number of balls |
Class mark |
Team A |
Team B |
|
0.5 - 6.5 |
3.5 |
2 |
5 |
|
6.5 - 12.5 |
9.5 |
1 |
6 |
|
12.5 - 18.5 |
15.5 |
8 |
2 |
|
18.5 - 24.5 |
21.5 |
9 |
10 |
|
24.5 - 30.5 |
27.5 |
4 |
5 |
|
30.5 - 36.5 |
33.5 |
5 |
6 |
|
36.5 - 42.5 |
39.5 |
6 |
3 |
|
42.5 - 48.5 |
45.5 |
10 |
4 |
|
48.5 - 54.5 |
51.5 |
6 |
8 |
|
54.5 - 60.5 |
57.5 |
2 |
10 |
By taking class marks on x-axis and runs scored on y-axis, a frequency polygon can be constructed as follows.
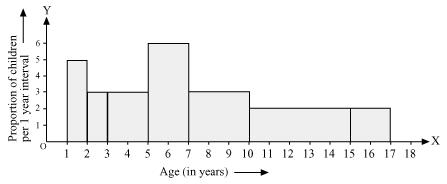
The class intervals in the data is having varying width. We know that the area of rectangle is proportional to the frequencies in the histogram. The class interval with minimum class size 1 is selected and the length of the rectangle is proportionate to it.
| Age (in years) | Number of children (frequency) | Width of class | Length of rectangle |
| 1-2 | 5 | 1 | (5/1)×1 = 5 |
| 2-3 | 3 | 1 | (3/1)×1 = 3 |
| 3-5 | 6 | 2 | (6/2)×1 = 3 |
| 5-7 | 12 | 2 | (12/2)×1 = 6 |
| 7-10 | 9 | 3 | (9/3)×1 = 3 |
| 10-15 | 10 | 5 | (10/5)×1 = 2 |
| 15-17 | 4 | 2 | (4/2)×1 = 2 |
Taking the age of children on x-axis and proportion of children per 1 year interval on y-axis, the histogram can be drawn
(i) The class intervals in the data is having varying width. We know that the area of rectangle is proportional to the frequencies in the histogram. The class interval with minimum class size 2 is selected and the length of the rectangle is proportionate to it.
The proportion of the surnames per 2 letters interval can be calculated as:
| Number of letters | Number of surnames | Width of class | Length of rectangle |
| 1-4 | 6 | 3 | (6/3)×2 = 4 |
| 4-6 | 30 | 2 | (30/2)×2 = 30 |
| 6-8 | 44 | 2 | (44/2)×2 = 44 |
| 8-12 | 16 | 4 | (16/4)×2 = 8 |
| 12-20 | 4 | 8 | (4/8)×2 = 1 |
By taking the number of letters on x-axis and the proportion of the number of surnames per 2 letters interval on y-axis and choosing an appropriate scale (1 unit = 4 students for y axis), the histogram can be constructed as follows.
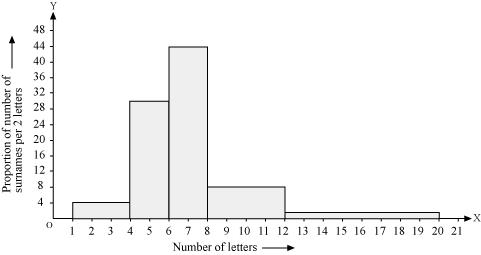
(ii) The class interval in which the maximum number of surnames lies is 6 - 8 as it has 44 surnames in it i.e., the maximum for this data.
We can find the class marks of the given class intervals by using the following formula.
Class mark
|
Section A |
Section B |
||||
|
Marks |
Class marks |
Frequency |
Marks |
Class marks |
Frequency |
|
0 - 10 |
5 |
3 |
0 - 10 |
5 |
5 |
|
10 - 20 |
15 |
9 |
10 - 20 |
15 |
19 |
|
20 - 30 |
25 |
17 |
20 - 30 |
25 |
15 |
|
30 - 40 |
35 |
12 |
30 - 40 |
35 |
10 |
|
40 - 50 |
45 |
9 |
40 - 50 |
45 |
1 |
Taking class marks on x-axis and frequency on y-axis and choosing an appropriate scale (1 unit = 3 for y-axis), the frequency polygon can be drawn as follows.
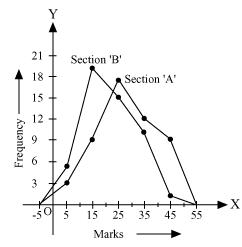
It can be observed that the performance of students of section 'A' is better than the students of section 'B' in terms of good marks.
The number of goals scored by the team is
2, 3, 4, 5, 0, 1, 3, 3, 4, 3
Arranging the number of goals in ascending order,
0, 1, 2, 3, 3, 3, 3, 4, 4, 5
The number of observations is 10, which is an even number. Therefore, median score will be the mean of 10/2 i.e., 5th and 10/2 +1
i.e., 6th observation while arranged in ascending or descending order.
Mode of data is the observation with the maximum frequency in data.
Therefore, the mode score of data is 3 as it has the maximum frequency as 4 in the data.
The marks of 15 students in mathematics test are
41, 39, 48, 52, 46, 62, 54, 40, 96, 52, 98, 40, 42, 52, 60
Arranging the scores obtained by 15 students in an ascending order,
39, 40, 40, 41, 42, 46, 48, 52, 52, 52, 54, 60, 62, 96, 98
As the number of observations is 15 which is odd, therefore, the median of data will be 15+1 / 2 = 8th observation whether the data is arranged in an ascending or descending order.
Therefore, median score of data = 52
Mode of data is the observation with the maximum frequency in data. Therefore, mode of this data is 52 having the highest frequency in data as 3.
It can be observed that the total number of observations in the given data is 10 (even number). Therefore, the median of this data will be the mean of 10 / 2 i.e., 5th and 10/2 +1 i.e., 6th observation.
|
Salary (xi) |
Number of workers (fi) |
fixi |
| 3000 | 16 | 48000 |
| 4000 | 12 | 48000 |
| 5000 | 10 | 50000 |
| 6000 | 8 | 48000 |
| 7000 | 6 | 42000 |
| 8000 | 4 | 32000 |
| 9000 | 3 | 27000 |
| 10000 | 1 | 10000 |
| Total |
Σfi = 60 | Σfixi = 305000 |
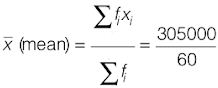
= 5083.33
Therefore, mean salary of 60 workers is Rs 5083.33.


