NCERT Solution: Statistics
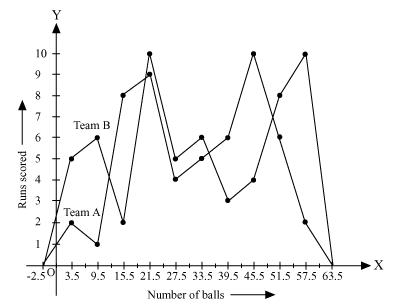
The runs scored by two teams A and B on the first 60 balls in a cricket match are given below:
|
Number of balls |
Team A |
Team B |
|
1 - 6 7 - 12 13 - 18 19 - 24 25 - 30 31 - 36 37 - 42 43 - 48 49 - 54 55 - 60 |
2 1 8 9 4 5 6 10 6 2 |
5 6 2 10 5 6 3 4 8 10 |
Represent the data of both the teams on the same graph by frequency polygons.
[Hint: First make the class intervals continuous.]
It can be observed that the class intervals of the given data are not continuous. There is a gap of 1 in between them. Therefore, 1/2 =0.5 has to be added to the upper class limits and 0.5 has to be subtracted from the lower class limits.
Also, class mark of each interval can be found by using the following formula.
Class mark 
Continuous data with class mark of each class interval can be represented as follows.
|
Number of balls |
Class mark |
Team A |
Team B |
|
0.5 - 6.5 |
3.5 |
2 |
5 |
|
6.5 - 12.5 |
9.5 |
1 |
6 |
|
12.5 - 18.5 |
15.5 |
8 |
2 |
|
18.5 - 24.5 |
21.5 |
9 |
10 |
|
24.5 - 30.5 |
27.5 |
4 |
5 |
|
30.5 - 36.5 |
33.5 |
5 |
6 |
|
36.5 - 42.5 |
39.5 |
6 |
3 |
|
42.5 - 48.5 |
45.5 |
10 |
4 |
|
48.5 - 54.5 |
51.5 |
6 |
8 |
|
54.5 - 60.5 |
57.5 |
2 |
10 |
By taking class marks on x-axis and runs scored on y-axis, a frequency polygon can be constructed as follows.
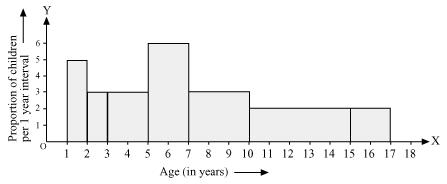
A random survey of the number of children of various age groups playing in park was found as follows:
|
Age (in years) |
Number of children |
|
1 - 2 2 - 3 3 - 5 5 - 7 7 - 10 10 - 15 15 - 17 |
5 3 6 12 9 10 4 |
Draw a histogram to represent the data above.
The class intervals in the data is having varying width. We know that the area of rectangle is proportional to the frequencies in the histogram. The class interval with minimum class size 1 is selected and the length of the rectangle is proportionate to it.
| Age (in years) | Number of children (frequency) | Width of class | Length of rectangle |
| 1-2 | 5 | 1 | (5/1)×1 = 5 |
| 2-3 | 3 | 1 | (3/1)×1 = 3 |
| 3-5 | 6 | 2 | (6/2)×1 = 3 |
| 5-7 | 12 | 2 | (12/2)×1 = 6 |
| 7-10 | 9 | 3 | (9/3)×1 = 3 |
| 10-15 | 10 | 5 | (10/5)×1 = 2 |
| 15-17 | 4 | 2 | (4/2)×1 = 2 |
Taking the age of children on x-axis and proportion of children per 1 year interval on y-axis, the histogram can be drawn
100 surnames were randomly picked up from a local telephone directory and a frequency distribution of the number of letters in the English alphabet in the surnames was found as follows:
|
Number of letters |
Number of surnames |
|
1 - 4 4 - 6 6 - 8 8 - 12 12 - 20 |
6 30 44 16 4 |
(i) Draw a histogram to depict the given information.
(ii) Write the class interval in which the maximum number of surname lie.
(i) The class intervals in the data is having varying width. We know that the area of rectangle is proportional to the frequencies in the histogram. The class interval with minimum class size 2 is selected and the length of the rectangle is proportionate to it.
The proportion of the surnames per 2 letters interval can be calculated as:
| Number of letters | Number of surnames | Width of class | Length of rectangle |
| 1-4 | 6 | 3 | (6/3)×2 = 4 |
| 4-6 | 30 | 2 | (30/2)×2 = 30 |
| 6-8 | 44 | 2 | (44/2)×2 = 44 |
| 8-12 | 16 | 4 | (16/4)×2 = 8 |
| 12-20 | 4 | 8 | (4/8)×2 = 1 |
By taking the number of letters on x-axis and the proportion of the number of surnames per 2 letters interval on y-axis and choosing an appropriate scale (1 unit = 4 students for y axis), the histogram can be constructed as follows.
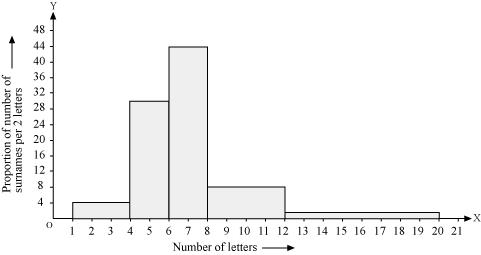
(ii) The class interval in which the maximum number of surnames lies is 6 - 8 as it has 44 surnames in it i.e., the maximum for this data.
The following table gives the distribution of students of two sections according to the mark obtained by them:
|
Section A |
Section B |
||
|
Marks |
Frequency |
Marks |
Frequency |
|
0 - 10 10 - 20 20 - 30 30 - 40 40 - 50 |
3 9 17 12 9 |
0 - 10 10 - 20 20 - 30 30 - 40 40 - 50 |
5 19 15 10 1 |
Represent the marks of the students of both the sections on the same graph by two frequency polygons. From the two polygons compare the performance of the two sections.
We can find the class marks of the given class intervals by using the following formula.
Class mark
|
Section A |
Section B |
||||
|
Marks |
Class marks |
Frequency |
Marks |
Class marks |
Frequency |
|
0 - 10 |
5 |
3 |
0 - 10 |
5 |
5 |
|
10 - 20 |
15 |
9 |
10 - 20 |
15 |
19 |
|
20 - 30 |
25 |
17 |
20 - 30 |
25 |
15 |
|
30 - 40 |
35 |
12 |
30 - 40 |
35 |
10 |
|
40 - 50 |
45 |
9 |
40 - 50 |
45 |
1 |
Taking class marks on x-axis and frequency on y-axis and choosing an appropriate scale (1 unit = 3 for y-axis), the frequency polygon can be drawn as follows.
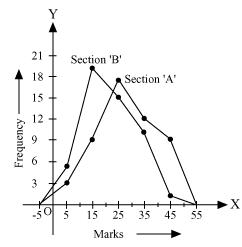
It can be observed that the performance of students of section 'A' is better than the students of section 'B' in terms of good marks.
The number of goals scored by the team is
2, 3, 4, 5, 0, 1, 3, 3, 4, 3
Arranging the number of goals in ascending order,
0, 1, 2, 3, 3, 3, 3, 4, 4, 5
The number of observations is 10, which is an even number. Therefore, median score will be the mean of 10/2 i.e., 5th and 10/2 +1
i.e., 6th observation while arranged in ascending or descending order.
Mode of data is the observation with the maximum frequency in data.
Therefore, the mode score of data is 3 as it has the maximum frequency as 4 in the data.
The marks of 15 students in mathematics test are
41, 39, 48, 52, 46, 62, 54, 40, 96, 52, 98, 40, 42, 52, 60
Arranging the scores obtained by 15 students in an ascending order,
39, 40, 40, 41, 42, 46, 48, 52, 52, 52, 54, 60, 62, 96, 98
As the number of observations is 15 which is odd, therefore, the median of data will be 15+1 / 2 = 8th observation whether the data is arranged in an ascending or descending order.
Therefore, median score of data = 52
Mode of data is the observation with the maximum frequency in data. Therefore, mode of this data is 52 having the highest frequency in data as 3.
It can be observed that the total number of observations in the given data is 10 (even number). Therefore, the median of this data will be the mean of 10 / 2 i.e., 5th and 10/2 +1 i.e., 6th observation.
Arranging the data in an ascending order,
14, 14, 14, 14, 17, 18, 18, 18, 22, 23, 25, 28
It can be observed that 14 has the highest frequency, i.e. 4, in the given data. Therefore, mode of the given data is 14.
Latest Post
Nazism and the Rise of HitlerClimate
Electoral Politics
Matter in Our Surroundings
Triangles