NCERT Solution: Statistics
(i) By observation of the digits after decimal point, the required table can be constructed as follows.
|
Digit |
Frequency |
|
0 |
2 |
|
1 |
5 |
|
2 |
5 |
|
3 |
8 |
|
4 |
4 |
|
5 |
5 |
|
6 |
4 |
|
7 |
4 |
|
8 |
5 |
|
9 |
8 |
|
Total |
50 |
(ii) It can be observed from the above table that the least frequency is 2 of digit 0, and the maximum frequency is 8 of digit 3 and 9. Therefore, the most frequently occurring digits are 3 and 9 and the least frequently occurring digit is 0.
(i) Our class intervals will be 0 - 5, 5 - 10, 10 - 15…..
The grouped frequency distribution table can be constructed as follows.
|
Hours |
Number of children |
|
0 - 5 |
10 |
|
5 - 10 |
13 |
|
10 - 15 |
5 |
|
15 - 20 |
2 |
|
Total |
30 |
(ii) The number of children who watched TV for 15 or more hours a week is 2 (i.e., the number of children in class interval 15 - 20).
A grouped frequency table of class size 0.5 has to be constructed, starting from class interval 2 - 2.5.
Therefore, the class intervals will be 2 - 2.5, 2.5 - 3, 3 - 3.5…
By observing the data given above, the required grouped frequency distribution table can be constructed as follows.
|
Lives of batteries (in years) |
Number of batteries |
|
2 - 2.5 |
2 |
|
2.5 - 3.0 |
6 |
|
3.0 - 3.5 |
14 |
|
3.5 - 4.0 |
11 |
|
4.0 - 4.5 |
4 |
|
4.5 - 5.0 |
3 |
|
Total |
40 |
A survey conducted by an organisation for the cause of illness and death among the women between the ages 15 - 44 (in years) worldwide, found the following figures (in %):
|
S.No. |
Causes |
Female fatality rate (%) |
|
1. 2. 3. 4. 5. 6. |
Reproductive health conditions Neuropsychiatric conditions Injuries Cardiovascular conditions Respiratory conditions Other causes |
31.8 25.4 12.4 4.3 4.1 22.0 |
(i) Represent the information given above graphically.
(ii) Which condition is the major cause of women's ill health and death worldwide?
(iii) Try to find out, with the help of your teacher, any two factors which play a major role in the cause in (ii) above being the major cause.
(i) By representing causes on x-axis and family fatality rate on y-axis and choosing an appropriate scale (1 unit = 5% for y axis), the graph of the information given above can be constructed as follows.
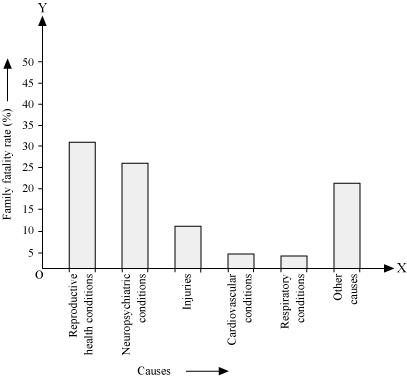
All the rectangle bars are of the same width and have equal spacing between them.
(ii) Reproductive health condition is the major cause of women's ill health and death worldwide as 31.8% of women are affected by it.
(iii) The factors are as follows.
1. Lack of medical facilities
2. Lack of correct knowledge of treatment
The following data on the number of girls (to the nearest ten) per thousand boys in different sections of Indian society is given below.
|
Section |
Number of girls per thousand boys |
|
Scheduled Caste (SC) Scheduled Tribe (ST) Non SC/ST Backward districts Non-backward districts Rural Urban |
940 970 920 950 920 930 910 |
(i) Represent the information above by a bar graph.
(ii) In the classroom discuss what conclusions can be arrived at from the graph.
(i) By representing section (variable) on x-axis and number of girls per thousand boys on y-axis, the graph of the information given above can be constructed by choosing an appropriate scale (1 unit = 100 girls for y-axis)
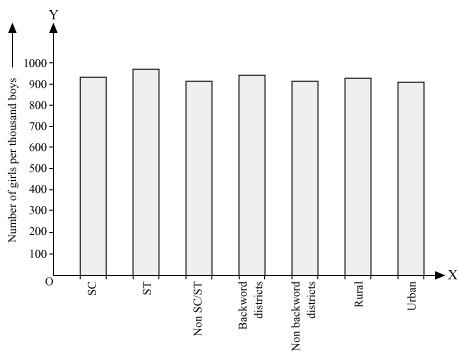
Here, all the rectangle bars are of the same length and have equal spacing in between them.
(ii) It can be observed that maximum number of girls per thousand boys (i.e., 970) is for ST and minimum number of girls per thousand boys (i.e., 910) is for urban.
Also, the number of girls per thousand boys is greater in rural areas than that in urban areas, backward districts than that in non-backward districts, SC and ST than that in non-SC/ST.
Given below are the seats won by different political parties in the polling outcome of a state assembly elections:
|
Political Party |
A |
B |
C |
D |
E |
F |
|
Seats Won |
75 |
55 |
37 |
29 |
10 |
37 |
(i) Draw a bar graph to represent the polling results.
(ii) Which political party won the maximum number of seats?
(i) By taking polling results on x-axis and seats won as y-axis and choosing an appropriate scale (1 unit = 10 seats for y-axis), the required graph of the above information can be constructed as follows.
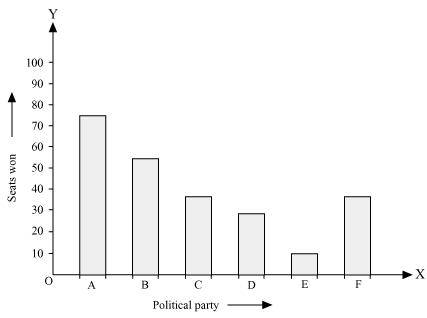
Here, the rectangle bars are of the same length and have equal spacing in between them.
(ii) Political party 'A' won maximum number of seats.
The length of 40 leaves of a plant are measured correct to one millimetre, and the obtained data is represented in the following table:
|
Length (in mm) |
Number of leaves |
|
118 - 126 127 - 135 136 - 144 145 - 153 154 - 162 163 - 171 172 - 180 |
3 5 9 12 5 4 2 |
(i) Draw a histogram to represent the given data.
(ii) Is there any other suitable graphical representation for the same data?
(iii) Is it correct to conclude that the maximum number of leaves are 153 mm long? Why?
(i) It can be observed that the length of leaves is represented in a discontinuous class interval having a difference of 1 in between them. Therefore,
1/2 =0.5 has to be added to each upper class limit and also have to subtract 0.5 from the lower class limits so as to make the class intervals continuous.
|
Length (in mm) |
Number of leaves |
|
117.5 - 126.5 |
3 |
|
126.5 - 135.5 |
5 |
|
135.5 - 144.5 |
9 |
|
144.5 - 153.5 |
12 |
|
153.5 - 162.5 |
5 |
|
162.5 - 171.5 |
4 |
|
171.5 - 180.5 |
2 |
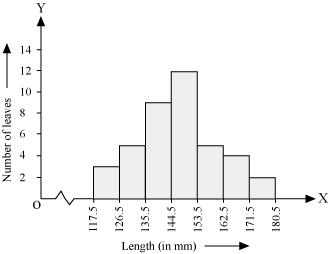
Taking the length of leaves on x-axis and the number of leaves on y-axis, the histogram of this information can be drawn as above.
Here, 1 unit on y-axis represents 2 leaves.
(ii) Other suitable graphical representation of this data is frequency polygon.
(iii) No, as maximum number of leaves (i.e., 12) has their length in between 144.5 mm and 153.5 mm. It is not necessary that all have their lengths as 153 mm.
The following table gives the life times of neon lamps:
|
Length (in hours) |
Number of lamps |
|
300 - 400 400 - 500 500 - 600 600 - 700 700 - 800 800 - 900 900 - 1000 |
14 56 60 86 74 62 48 |
(i) Represent the given information with the help of a histogram.
(ii) How many lamps have a lifetime of more than 700 hours?
(i) By taking life time (in hours) of neon lamps on x-axis and the number of lamps on y-axis, the histogram of the given information can be drawn as follows.

Here, 1 unit on y-axis represents 10 lamps.
(ii) It can be concluded that the number of neon lamps having their lifetime more than 700 is the sum of the number of neon lamps having their lifetime as 700 - 800, 800 - 900, and 900 - 1000.
Therefore, the number of neon lamps having their lifetime more than 700 hours is 184. (74 + 62 + 48 = 184)
Latest Post
Human Eye and Colourful WorldAnimal Kingdom
Plant Kingdom
Improvement in Food Resources
Sources of Energy