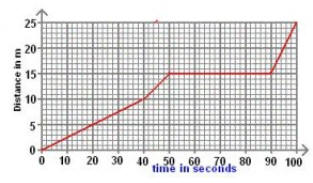
Motion What is the position of the body in the time interval 60-70 seconds?
(1)
15 m
(2)
5 m
(3)
10 m
(4)
20 m
| A. | Option 1 |
| B. | Option 2 |
| C. | Option 3 |
| D. | Option 4 |
|
Option: 1 Solution : -. |
Motion If you whirl a stone on the end of the string and the string suddenly breaks,
the stone will:
(1) Fly off along the tangent to its circular path.
(2) Fly directly towards you.
(3) Spiral away from your hand.
(4) Spiral in towards your hand.
| A. | Option 1 |
| B. | Option 2 |
| C. | Option 3 |
| D. | Option 4 |
|
Option: 4 Solution : -. |
Motion Rate of change of angular velocity refer to :
(1) angular speed
(2) angular displacement
(3) angular acceleration
(4) None of these
| A. | Option 1 |
| B. | Option 2 |
| C. | Option 3 |
| D. | Option 4 |
|
Option: 3 Solution : -. |
Motion 40 A body starts falling from height 'h' and travels distance h/2 during
the last second of motion. The time of travel (in sec.) is-
(1) √ 2 -1
(2) 2 + √2
(3) √2+ √3
(4) √3 +2
| A. | Option 1 |
| B. | Option 2 |
| C. | Option 3 |
| D. | Option 4 |
|
Option: 2 Solution : -. |
Motion A body freely falling from rest has a velocity v after it falls through a height h. The distance it has to fall further for its velocity to become double is -
(1) 3 h
(2) 6 h
(3) 8 h
(4) 10 h
| A. | Option 1 |
| B. | Option 2 |
| C. | Option 3 |
| D. | Option 4 |
|
Option: 1 Solution : -. |
Motion A stone is dropped from the top of a tower. Its velocity after it has fallen
20 m is (take g = 10m/s2)
(1) –10 m/s (2) 10 m/s (3) – 20 m/s (4) 20 m/s
| A. | Option 1 |
| B. | Option 2 |
| C. | Option 3 |
| D. | Option 4 |
|
Option: 3 Solution : -. |
Motion The displacement covered by a seconds’ hand of radius r in a clock after
one revolution is:
(1) 360 degree
(2) zero
(3) 3r
(4) 2r
| A. | Option 1 |
| B. | Option 2 |
| C. | Option 3 |
| D. | Option 4 |
|
Option: 2 Solution : -. |
Motion The displacement-time graph for a body is given below. State whether the
velocity and acceleration of the body in the region DE are positive , negative
or Zero.
(1)
V= +v e but a=0
(2)
V = -ve and a = -ve
(3)
V = + ve and a = + ve
(4)
V = +ve and a = -ve
| A. | Option 1 |
| B. | Option 2 |
| C. | Option 3 |
| D. | Option 4 |
|
Option: 3 Solution : -. |
Motion The initial velocity of the free falling object is _____________?
(1) More
(2) Less
(3) Zero
(4) 9.8 m/s
| A. | Option 1 |
| B. | Option 2 |
| C. | Option 3 |
| D. | Option 4 |
|
Option: 3 Solution : -. |
Motion For the velocity time graph shown in figure,
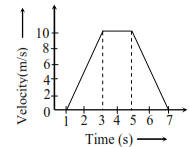
the distance covered by the body in the last two seconds of its motion is what fraction of the total distance covered in all the seven seconds ?
(1) 1/2
(2) 1/4
(3) 1/3
(4) 2/3
| A. | Option 1 |
| B. | Option 2 |
| C. | Option 3 |
| D. | Option 4 |
|
Option: 2 Solution : -. |

